Guide
Vector Scanner: Cross-Ticker Gamma & Flow Radar
How to read the Vector scanner: cross-ticker GEX ladders, wall integrity scoring, gamma magnet, confluence zones, regime banner, and the universe screener.
SPX Slayer is built around SPX specifically. Thermal goes deep on whichever ticker you select — SPY, SPX, QQQ, and dozens more, one at a time. Vector extends the same dealer gamma exposure framework across the entire universe at once — ranked setups from the BIE verification engine across multiple tickers, each with its own GEX ladder, regime posture, wall integrity scores, and confluence zones, with no ticker to pick first. If Thermal is the microscope you point at one name, Vector is the radar dish scanning the whole board automatically.
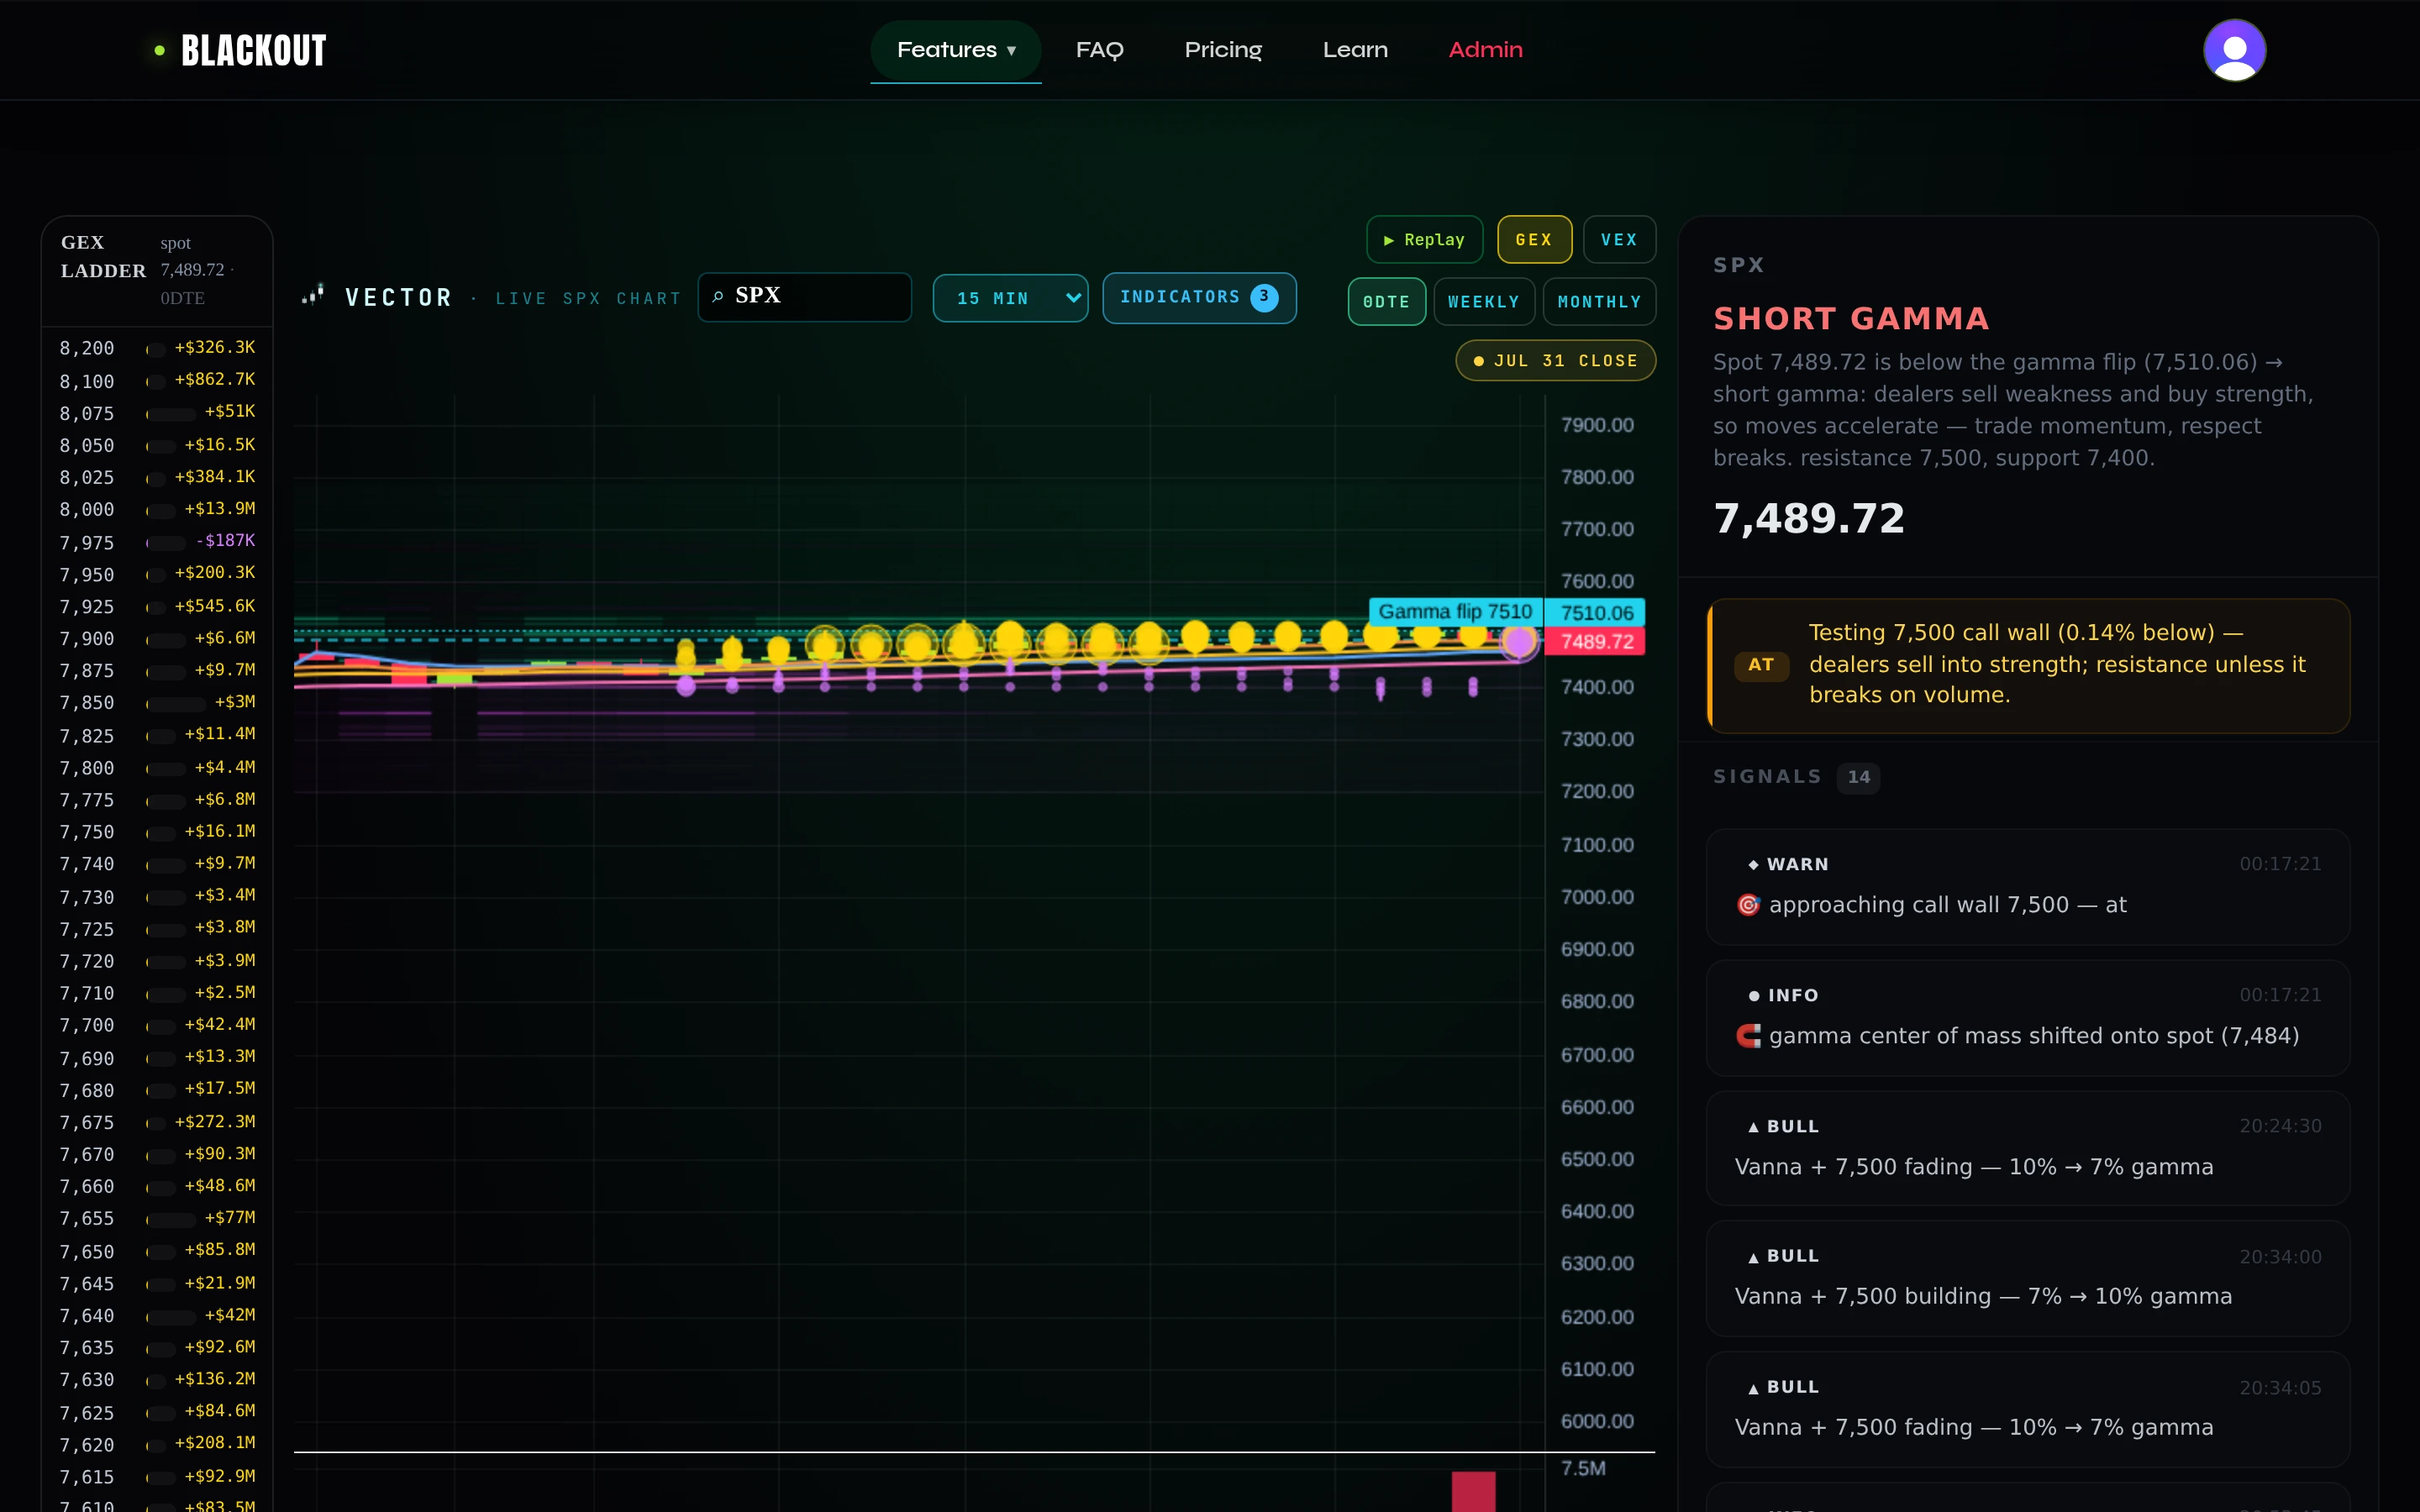
The universe screener
The top-level view is a ranked table of tickers, each carrying the core positioning read:
| Column | What it shows |
|---|---|
| Ticker | The instrument — SPY, QQQ, NVDA, AAPL, any name in the scanner universe |
| Spot | Current price |
| Gamma flip | The price where dealer gamma crosses zero — historically, above tends toward pinning and below tends toward trending; one regime input, not a guarantee |
| VEX flip | The vanna-exposure crossover — the hedging-pressure counterpart from delta-vanna, not gamma |
| Top call wall | The strike with the largest concentration of call gamma (likely resistance) |
| Top put wall | The strike with the largest concentration of put gamma (likely support) |
| Top call % | The call wall's net-gamma share (0-100) — how dominant that wall is |
| Top put % | The put wall's net-gamma share — how dominant the support level is |
The screener supports preset views: nearest-flip (tickers closest to crossing their gamma flip — the most actionable regime-change candidates), most-pinned (above the flip with strong walls — mean-reversion setups), and most-explosive (below the flip and close to it — dealers amplifying, vol-expansion risk). Each preset is a sort and filter on the data already loaded, not a different data source.
GEX Ladder: the per-strike breakdown
Select a ticker and the panel expands to the GEX ladder — the per-strike GEX profile for that name. This is the same data concept as Thermal's heatmap but in ladder form: each strike shows the net gamma parked there, with the call wall, put wall, and gamma flip marked directly on the ladder. Wall beads — the visual markers for gamma concentration — track across the session, building a wall lifecycle that the Cortex evidence system reads as one of its eight independent sources.
Regime Read: the one-line regime read
Above the ladder sits the regime banner — the current gamma regime in a single line:
- LONG GAMMA (calm tone) — spot is above the gamma flip. Dealers hedge against moves: sell rallies, buy dips. Price tends to pin and mean-revert. Expect chop; fade extremes. - SHORT GAMMA (volatile tone) — spot is below the flip. Dealers hedge with the move: sell weakness, buy strength. Volatility feeds on itself. Respect momentum. - TRANSITION (neutral tone) — spot is within 0.1% of the flip. The regime is undecided. Sit on your hands or use smaller positions until it commits.
The banner includes the flip level, the nearest wall on each side, and a plain-English read of what the regime implies for the session — a read, not a forecast; dealer gamma is one input into how a session behaves, not a binary switch that determines it. This is the same interpretation layer covered in the gamma flip explainer — Vector just computes it live for every ticker in the universe, not just SPX.
Wall integrity scoring: is this wall real?
Not all gamma walls are equal. A bead on the chart could represent a wall that has held all session against multiple tests, or one that blinked into existence two minutes ago. The wall integrity score (0-100) distinguishes them by blending three independent factors:
- STRENGTH (weight 0.45) — the wall's net-gamma share (`pct`). A wall that concentrates 40% of the side's gamma is structurally more important than one at 8%. This is the dominant driver. - PERSISTENCE (weight 0.35) — what fraction of recent history-rail samples included this strike as a wall. A level defended across 50+ snapshots over the session is far more trustworthy than one with a single appearance. When the history rail has fewer than 3 samples (e.g., shortly after the open), persistence reports "unknown" (neutral 0.5) rather than fabricating "proven." - ISOLATION (weight 0.20) — how far the wall towers over the next wall on its side. A clean, dominant level is isolated; one inside a cluster of similar-sized walls is diffuse. A single-wall side (no second wall) scores as fully isolated.
The score maps to three tiers: firm (70+), moderate (45-69), thin (below 45). A firm wall has held, dominates, and stands alone — trade around it with confidence. A thin wall is a suggestion, not a structure — do not rely on it for your stop or target.
Gamma magnet: the hedging center of mass
The gamma magnet is the strength-weighted mean of all gamma wall strikes — the center of mass of dealer hedging pressure. Its behavior depends on the regime:
- In long gamma (spot above the flip), the magnet is a genuine pin — price is drawn toward it because dealers hedge against moves, creating a gravitational pull. - In short gamma (spot below the flip), the same level is a pivot — once broken, price accelerates away because dealers hedge with the move. Calling it a "magnet" in short gamma would misrepresent the flow. - In transition or unknown, it is reported as a neutral center of mass with no directional claim.
The magnet reports its distance from spot (as a signed percentage), which way it pulls (up, down, or "at" when within 0.15% — effectively sitting on it), and a desk-terminal one-liner phrased by regime.
Confluence zones: where multiple levels agree
Vector derives many independent price levels: gamma walls, the gamma flip, max pain, auto-fib golden pockets, session and prior-day levels, floor pivots. A single level is interesting. Several independent levels stacking within ~0.15% of spot is a trade location.
The confluence engine clusters these levels and scores each cluster using transparent weights: dealer positioning levels (walls, flip) weigh most heavily (weight 3.0 for walls, 2.5 for the flip), then derived levels (max pain, golden pocket at 2.0), then classical levels (prior-day high/low, pivots at 1.5). A cluster only ranks as confluence with 2 or more distinct level types — five fib lines stacked on each other is one signal repeated, not five signals agreeing.
GEX Shift Leaders: who moved the most
The GEX Shift Leaders strip surfaces the tickers with the largest intraday GEX shift — names where the dealer positioning landscape changed the most since the prior read. A large shift signals that the gamma structure is actively reorganizing — treat it as a heads-up worth watching, not a forecast. We haven't published a measured hit-rate for how often a large shift is followed by a regime change or wall break, so we don't claim one here.
Alerts and replay
The Vector alerts panel flags when a watched ticker crosses a material threshold: a gamma flip crossing (regime change), a wall break, a confluence zone test. Replay controls let you step backward through the session's snapshots, watching how the GEX ladder and walls evolved over time — the same lifecycle data the Cortex wall-trend source reads, but presented visually.
How Vector fits the desk
Vector answers "where in the broader market is the gamma structure most interesting right now?" Thermal gives you the deep heatmap for whichever ticker you pick. SPX Slayer executes on SPX. HELIX scans the flow tape. The 0DTE Command scanner uses multi-ticker flow and structure for intraday entries. And Largo AI can pull any Vector ticker's GEX, regime, and walls into a conversational answer.
For the underlying concepts — what gamma exposure means, how the gamma flip works, why the Greeks matter, and how delta hedging creates these levels — see the deep-dive library. Get access →
BlackOut provides educational tools and market analysis only and does not provide investment advice. Options and equities trading involve substantial risk and are not suitable for every investor.
Related guides
Gamma Flip Explained: The Single Most Important Level on the Board
The gamma flip is the price where dealers switch from stabilizing the market to amplifying it. Learn to find it and why it defines the character of the day.
What Is Dealer Gamma Exposure? A Trader's Guide to Reading the Market Like the Desks Do
Dealer gamma exposure explains why the market pins, accelerates, or reverses at key levels. Learn how to read it — and trade before the crowd moves.
Night Hawk Cortex: The Evidence Brain Behind Every Commit
How the Cortex evidence system works: 8 independent sources, evidence decay, veto asymmetry, conviction bands, and the precision-first commit model.
0DTE Command: The Always-On Intraday Scanner
How the 0DTE Command scanner works: session heat states, hard entry gates, confluence system, thesis health, and the always-on multi-ticker intraday engine.
Ready to trade with live dealer gamma?
See plans and open the desk — SPX Slayer from $49/mo.
View pricing →