Guide
How to Read BlackOut Thermal Heatmaps
How to read BlackOut Thermal heatmaps — matrix view, exposure profile, King nodes, flip and wall levels, HELIX flow overlay, dark pool lines, and alerts.
Thermal is BlackOut's dealer-positioning visualization — a live heatmap that shows where gamma exposure (and vanna, delta, and charm) concentrates across the options chain. It has two primary views, a set of overlay layers, and a key-level summary box. Here is how to read each component.
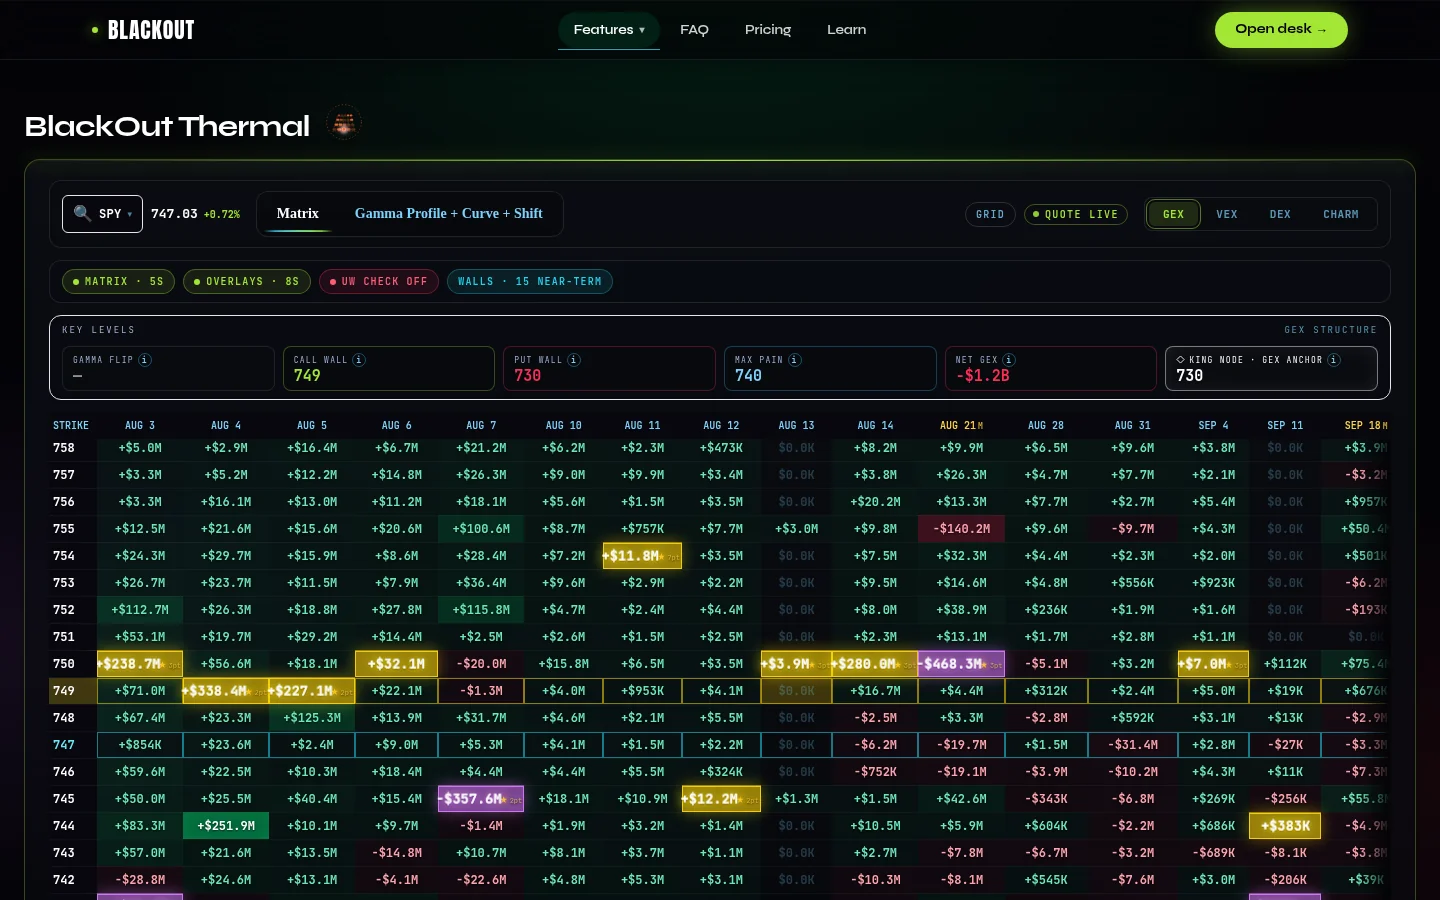
Matrix view
A strike-by-expiry heat table. Each cell contains the signed dollar exposure at that intersection — positive (green) where dealers are long gamma, negative (red) where short. The diverging color scale runs from deep red through gray to deep green. The spot row (current price) is highlighted; the default ticker is SPY, switchable to any supported name.
Profile view
The profile view collapses the matrix into a single-axis chart — exposure by strike, summed across all selected expirations. This is where the shape of dealer positioning becomes visually obvious.
Exposure bars. Horizontal bars extending left (negative, red) or right (positive, green) from a zero axis. The length of each bar is the net exposure at that strike. Three markers anchor the profile:
- Spot marker — a vertical line at the current price, so you see where the underlying sits relative to the gamma landscape. - Flip marker — the price where the bars cross from positive to negative, the gamma flip. Above it, expect range compression; below it, expect amplification. - King marker — the strike with the single largest absolute gamma concentration. It often — but not always — coincides with the call wall or put wall. When the King node sits at the call wall, that level carries extra weight as a ceiling.
HELIX flow overlay. Aggregated institutional flow from HELIX layered onto the profile — see whether aggressive flow is pushing into a gamma wall (likely rejection) or thin positioning (likely follow-through). See HELIX Flow Scanner Guide.
Dark pool lines. Dark pool block prints plotted as horizontal reference lines where off-exchange size traded. When a dark pool line sits at a gamma wall, the reinforcement is significant.
Cumulative curve. A running sum of exposure from lowest to highest strike. The slope shows where exposure builds fastest; where it crosses zero corresponds to the gamma flip.
Shift view. Shows how the profile has changed since the prior snapshot (open, prior close, or user-selected reference). Green shading = exposure increased; red = decreased. This is how you catch wall migration mid-session.
Expiry filter chips
A row of toggle chips at the top of the profile lets you filter which expirations feed the profile:
- All — every open expiry, the full-chain picture. - 0DTE — same-day contracts only, isolating intraday gamma. See 0DTE SPX Options Strategy. - Near — next few expirations (0-3 DTE), short-term positioning without far-out monthly noise. - Monthly — monthly expirations only, which carry the most open interest and define structural walls.
Switching scopes answers "is the call wall driven by 0DTE gamma or by the monthly?" — 0DTE walls evaporate by the close while monthly walls persist.
Key Levels
A summary panel showing the critical levels extracted from the active lens and scope:
- Flip — the gamma flip price. - Walls — the call wall and put wall strikes and their magnitudes. - Max pain — the max pain strike for the selected expiry scope. - King node — the single largest gamma concentration. - Net total — the aggregate signed exposure (positive = long gamma environment, negative = short gamma). - Day-over-day deltas — how each of these levels has shifted since the prior session's close. A call wall that moved up 20 points overnight tells a different story than one that sat still.
Alerts
A banner of real-time alerts that fires when key events occur:
- Wall breaks — price has moved through a call wall or put wall. A wall break is a momentum signal, not a fade (see Call Wall & Put Wall Explained). - Flip crosses — price has crossed the gamma flip, switching the session's regime from positive to negative gamma or vice versa. This is the single most important intraday event on the Thermal board.
Alerts are timestamped and persist for the session so you can scroll back to see what levels were tested and when.
Putting it all together
Start with the Key Levels panel for the five-second read. Check the profile shape and King node. Layer on HELIX flow and dark pool lines for activity convergence. Use the expiry filter chips to isolate 0DTE vs. monthly contributions, and watch the alerts strip for wall breaks and flip crosses.
For the four exposure lenses, see Thermal's Four Lenses Explained. For strike selection, see Using Thermal for Strike Selection. For how this same gamma structure reads on a specific earnings print, see Meridian: The Earnings Desk. Get access →
BlackOut provides educational tools and market analysis only and does not provide investment advice. Options trading involves substantial risk and is not suitable for every investor.
Related guides
Call Wall & Put Wall Explained: The Gamma Levels That Act Like Magnets
Call walls and put walls are where dealer gamma concentrates — often acting as magnets, resistance, and support. Learn to read them on the SPX chain.
Gamma Flip Explained: The Single Most Important Level on the Board
The gamma flip is the price where dealers switch from stabilizing the market to amplifying it. Learn to find it and why it defines the character of the day.
Thermal's Four Lenses: GEX, VEX, DEX & CHARM
Thermal's four exposure lenses — GEX for gamma walls, VEX for vanna, DEX for delta posture, CHARM for time-decay pinning — and when to use each one.
Using Thermal for Options Strike Selection
How to use Thermal's gamma levels for options strike selection — call wall resistance, put wall support, iron condor placement, and gamma flip as a filter.
Ready to trade with live dealer gamma?
See plans and open the desk — SPX Slayer from $49/mo.
View pricing →