Guide
Call Wall & Put Wall Explained: The Gamma Levels That Act Like Magnets
Call walls and put walls are where dealer gamma concentrates — often acting as magnets, resistance, and support. Learn to read them on the SPX chain.
Traders draw support and resistance from past price. Dealers have a different kind of level — one built from where options gamma piles up. The two biggest are the call wall and the put wall, and they often behave like magnets and barriers on the SPX chart.
What a call wall is
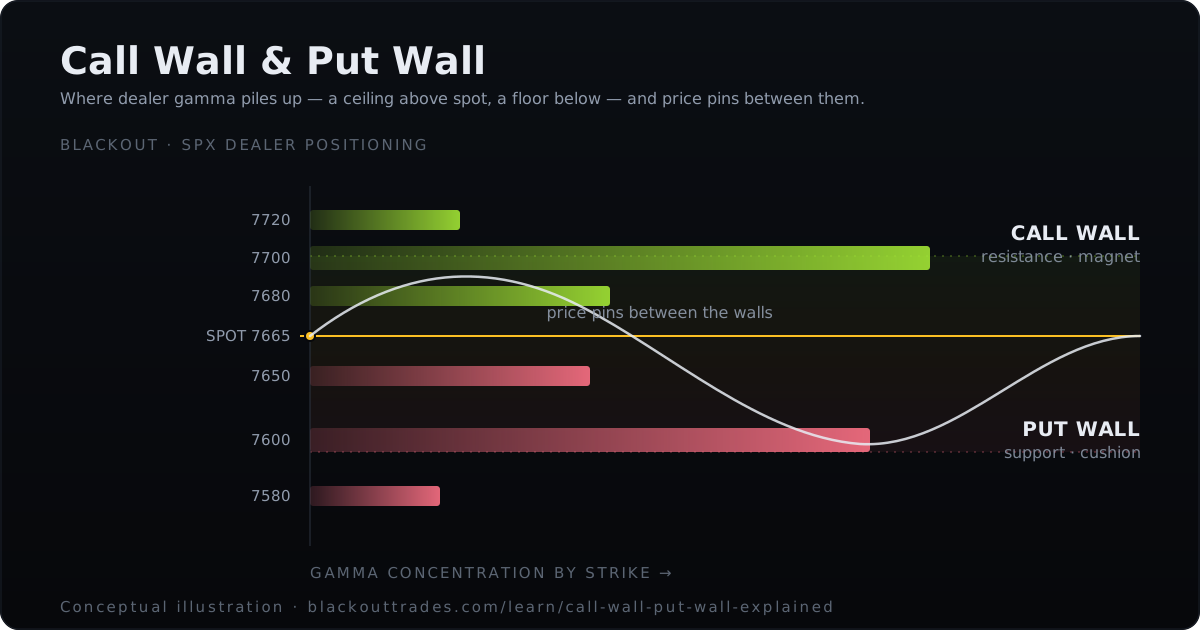
The call wall is the strike above current price with the largest concentration of call gamma. Because dealers are hedging all those calls, price often gets pinned toward the wall and struggles to break above it — it acts like resistance or a magnet. When a call wall finally breaks, it can trigger a fast move as dealers scramble to re-hedge.
What a put wall is
The put wall is the mirror image below price — the strike with the largest concentration of put gamma. It frequently acts as support: dealer hedging tends to cushion declines as price approaches it. A decisive break below the put wall often signals that support has failed and volatility is about to expand.
A concrete example
SPX opens at 5,500. The call wall sits at 5,550 — a massive cluster of open call interest at that strike — and the put wall sits at 5,430. Between those two levels, the session has a defined range: dealer hedging sells every push toward 5,550 and buys every dip toward 5,430, keeping price bracketed.
At 11 AM, a strong earnings beat from a mega-cap tech name pushes SPX to 5,545. It stalls. Pushes to 5,548, pulls back to 5,540, pushes again — and can't break through. That's the call wall: each tick toward 5,550 triggers more dealer selling as they hedge the gamma concentrated there. By noon the market has given up and settled back to 5,520.
Now consider the opposite. A weak macro print sends SPX sliding toward 5,430. The put wall catches the first test, then the second. But on the third attempt, price closes decisively below 5,425 and doesn't bounce. The hedging cushion is gone — the put wall has broken — and the session accelerates lower. That break is a momentum signal, not a fade.
Why these levels work
They aren't superstition. Large gamma concentrations force large hedging flows exactly at those strikes, and that mechanical buying and selling is what creates the "stickiness." It's the same force behind the gamma flip — just concentrated at specific strikes instead of a single regime line. The underlying mechanism is delta hedging at scale: as price approaches a strike loaded with gamma, dealers must buy or sell aggressively to stay neutral (see Delta Hedging Explained for how that process works tick by tick). Background: What Is Dealer Gamma Exposure?.
How walls shift during the session
Walls are not static. They move as new options are opened, existing positions are closed, and contracts expire. A call wall at 5,550 in the morning can weaken by the afternoon if large call holders roll or close their positions. Conversely, a surge in put buying can strengthen the put wall or shift it to a different strike entirely.
On 0DTE expirations, the effect is even more pronounced: same-day contracts carry enormous gamma that evaporates by the close, so the walls that define the morning range may not be the ones that matter at 3 PM. Checking the live gamma profile mid-session — not just at the open — is how you catch these shifts before they catch you.
Walls and max pain
You'll often see max pain sitting near a wall — that's not a coincidence. Max pain is calculated from the same open interest that builds the walls, so they tend to cluster in the same zone. When max pain, the call wall, and the put wall all converge on a tight range, the case for a pinning session is strong — three independent reads pointing the same direction — though traders holding short options near a pin should be aware of pin risk at expiration. When they diverge — say max pain at 5,490 but the call wall at 5,560 and the put wall at 5,420 — the gamma walls are the more mechanically grounded levels to trade against, because they represent actual hedging flow rather than a static payout calculation. Use max pain as a tiebreaker, not a primary level.
How to use them
Treat the call wall as a likely ceiling and the put wall as a likely floor while they hold — and treat breaks of either as momentum signals, not fades. Combine them with the gamma flip to build a full picture: where the day pins, and where it breaks. Walls also inform premium-selling structures: placing iron condor short strikes at or just past the walls gives a mechanical reason to expect the range to hold.
See them live
BlackOut Thermal plots the call wall and put wall across strikes and expirations in real time, so you're trading the same levels the desks are — not drawing lines from yesterday's chart. Get access →
BlackOut provides educational tools and market analysis only and does not provide investment advice. Options trading involves substantial risk and is not suitable for every investor.
Related guides
Gamma Flip Explained: The Single Most Important Level on the Board
The gamma flip is the price where dealers switch from stabilizing the market to amplifying it. Learn to find it and why it defines the character of the day.
What Is Dealer Gamma Exposure? A Trader's Guide to Reading the Market Like the Desks Do
Dealer gamma exposure explains why the market pins, accelerates, or reverses at key levels. Learn how to read it — and trade before the crowd moves.
Max Pain in Options: What It Is and How to Use It
Max pain theory explained — how it's calculated, whether it actually predicts price, and how it relates to dealer gamma walls and the pin at expiration.
Pin Risk in Options: When Expiration Gets Dangerous
Pin risk occurs when the underlying closes near a short strike at expiration. Learn why it happens, the dangers of partial assignment, and how to avoid it.
Ready to trade with live dealer gamma?
See plans and open the desk — SPX Slayer from $49/mo.
View pricing →